How to estimate return periods of extreme values
[1]:
import earthkit.data as ekd
import earthkit.plots as ekp
import xarray as xr

import earthkit.meteo.stats as ekm_stats

ekd.settings.set("cache-policy", "user")
Load a timeseries of yearly maximum 1-day precipitation from CDS: https://doi.org/10.24381/cds.3a9c4f89
[2]:
rx1day = ekd.from_source(
    "cds",
    "sis-european-risk-extreme-precipitation-indicators",
    spatial_coverage=["europe"],
    variable=["maximum_1_day_precipitation"],
    product_type=["era5"],
    temporal_aggregation=["yearly"],
    period=[
        "1979",
        "1980",
        "1981",
        "1982",
        "1983",
        "1984",
        "1985",
        "1986",
        "1987",
        "1988",
        "1989",
        "1990",
        "1991",
        "1992",
        "1993",
        "1994",
        "1995",
        "1996",
        "1997",
        "1998",
        "1999",
        "2000",
        "2001",
        "2002",
        "2003",
        "2004",
        "2005",
        "2006",
        "2007",
        "2008",
        "2009",
        "2010",
        "2011",
        "2012",
        "2013",
        "2014",
        "2015",
        "2016",
        "2017",
        "2018",
        "2019",
    ],
)
Fit an extreme value distribution to the timeseries of maximum precipitation values at every gridpoint:
[3]:
dist = ekm_stats.fit_gumbel(rx1day.to_xarray()["rx1day"], dim="time")
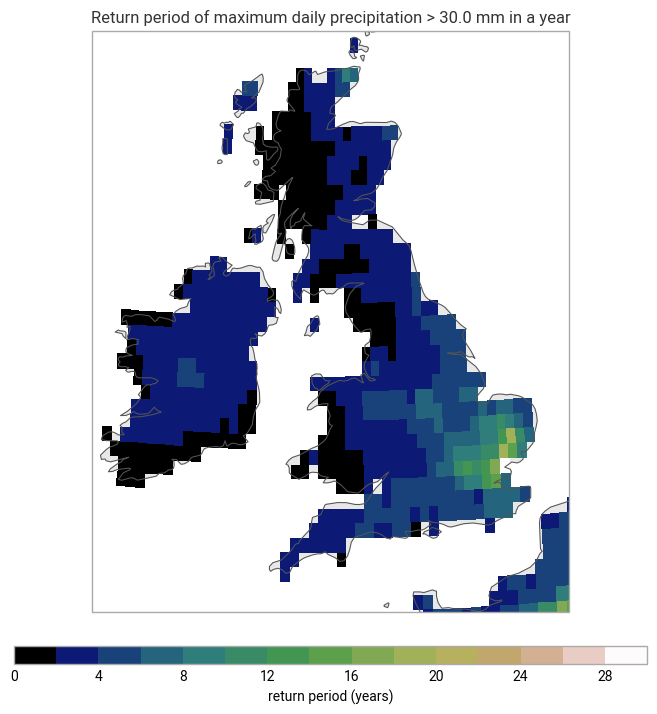
Determine the return period of years where the maximum daily precipitation exceeds a threshold value (here: 30 mm) based on the fitted distribution:
[4]:
threshold = 30.0

return_period = ekm_stats.value_to_return_period(xr.DataArray(threshold), dist)
Visualize the computed return periods on a map:
[5]:
chart = ekp.Map(domain=["UK", "Ireland"])
chart.grid_cells(return_period, colors="gist_earth")

chart.title(f"Return period of maximum daily precipitation > {threshold} mm in a year")
chart.legend(label="return period (years)")

chart.coastlines()
chart.land()
[5]:
<cartopy.mpl.feature_artist.FeatureArtist at 0x30c0056d0>