Fieldlist: Interpolating from pressure to pressure levels
This notebook demonstrates how to interpolate GRIB fieldlist data on pressure levels to another set of pressure levels with interpolate_monotonic(). We will use earthkit-data for fieldlist support and earthkit-plots for plotting.
[1]:
import earthkit.data as ekd
import earthkit.plots as ekp
import numpy as np

import earthkit.meteo.vertical.fieldlist as vertical
Getting the data
The input is GRIB data on pressure levels for one step. We fetch the file and extract the temperature fields from it.
[2]:
fl = ekd.from_source("sample", "tz_pl_global.grib1").to_fieldlist()
t = fl.sel({"parameter.variable": "t"})
t.ls()
[2]:
| parameter.variable | time.valid_datetime | time.base_datetime | time.step | vertical.level | vertical.level_type | ensemble.member | geography.grid_type | |
|---|---|---|---|---|---|---|---|---|
| 0 | t | 2019-06-02 12:00:00 | 2019-06-02 12:00:00 | 0 days | 1000 | pressure | 0 | regular_ll |
| 1 | t | 2019-06-02 12:00:00 | 2019-06-02 12:00:00 | 0 days | 850 | pressure | 0 | regular_ll |
| 2 | t | 2019-06-02 12:00:00 | 2019-06-02 12:00:00 | 0 days | 700 | pressure | 0 | regular_ll |
| 3 | t | 2019-06-02 12:00:00 | 2019-06-02 12:00:00 | 0 days | 500 | pressure | 0 | regular_ll |
| 4 | t | 2019-06-02 12:00:00 | 2019-06-02 12:00:00 | 0 days | 400 | pressure | 0 | regular_ll |
| 5 | t | 2019-06-02 12:00:00 | 2019-06-02 12:00:00 | 0 days | 300 | pressure | 0 | regular_ll |
| 6 | t | 2019-06-02 12:00:00 | 2019-06-02 12:00:00 | 0 days | 250 | pressure | 0 | regular_ll |
| 7 | t | 2019-06-02 12:00:00 | 2019-06-02 12:00:00 | 0 days | 200 | pressure | 0 | regular_ll |
| 8 | t | 2019-06-02 12:00:00 | 2019-06-02 12:00:00 | 0 days | 150 | pressure | 0 | regular_ll |
| 9 | t | 2019-06-02 12:00:00 | 2019-06-02 12:00:00 | 0 days | 100 | pressure | 0 | regular_ll |
| 10 | t | 2019-06-02 12:00:00 | 2019-06-02 12:00:00 | 0 days | 70 | pressure | 0 | regular_ll |
| 11 | t | 2019-06-02 12:00:00 | 2019-06-02 12:00:00 | 0 days | 50 | pressure | 0 | regular_ll |
| 12 | t | 2019-06-02 12:00:00 | 2019-06-02 12:00:00 | 0 days | 30 | pressure | 0 | regular_ll |
Using interpolate_monotonic
We use interpolate_monotonic() to carry out the interpolation. For fieldlist input it requires a distinct set of input levels, which does not need to be sorted (according to the level).
interpolate_monotonic() uses the coord, target_coord and coord_type arguments to specify the source and target coordinates and their shared type.
Our use case is rather simple since the input data is defined on the same level type (pressure) as coord and target_coord. This means we can omit the coord and coord_type arguments and let earthkit-meteo infer them from the input.
[3]:
# define the target coordinates
target_coord = [87000.0, 35000.0]  # Pa

t_res = vertical.interpolate_monotonic(
    t,  # data to interpolate
    target_coord=target_coord,
    interpolation="linear",
)
Alternatively, we can specify all the arguments explicitly. This requires extracting the vertical coordinate values from the input data.
[4]:
# extract the coordinates of the input fields
coord = np.array(t.get("vertical.level")) * 100.0  # Pa

# define the target coordinates
target_coord = [87000.0, 35000.0]  # Pa

# define the coordinate type
# (must be an earthkit-data "vertical.level_type")
coord_type = "pressure"

t_res = vertical.interpolate_monotonic(
    t,  # data to interpolate
    coord=coord,
    target_coord=target_coord,
    coord_type=coord_type,
    interpolation="linear",
)
[5]:
# list the result
t_res.ls()
[5]:
| parameter.variable | time.valid_datetime | time.base_datetime | time.step | vertical.level | vertical.level_type | ensemble.member | geography.grid_type | |
|---|---|---|---|---|---|---|---|---|
| 0 | t | 2019-06-02 12:00:00 | 2019-06-02 12:00:00 | 0 days | 870.0 | pressure | 0 | regular_ll |
| 1 | t | 2019-06-02 12:00:00 | 2019-06-02 12:00:00 | 0 days | 350.0 | pressure | 0 | regular_ll |
[6]:
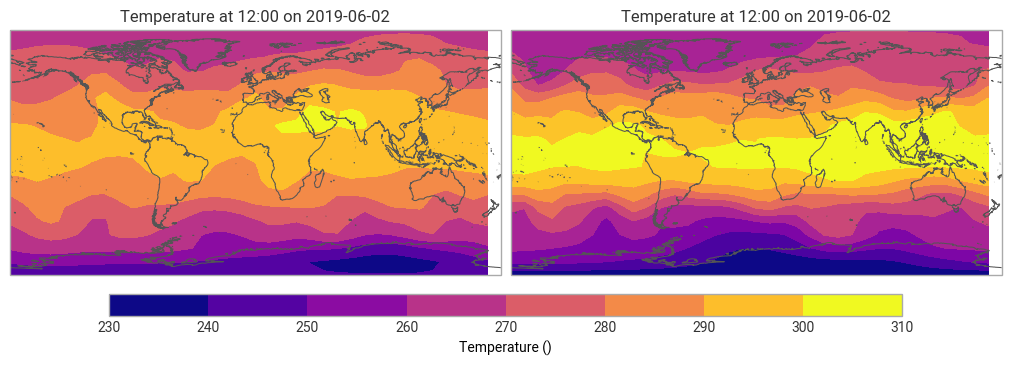
# plot the resulting fields
ekp.quickplot(t_res)
[6]:
<earthkit.plots.components.figures.Figure at 0x1147b7770>
Interpolating to a pressure field
The target pressure in interpolate_monotonic() can also be a field/fieldlist, with changing target in each gridpoint. To demonstrate this we interpolate the temperature to the pressure of the 2 PVU potential vorticity level. First, we fetch this field for the same date and time as our input data.
[7]:
pres_pv = ekd.from_source("sample", "pressure_on_pv_global.grib1").to_fieldlist()[0]
pres_pv.ls()
[7]:
| parameter.variable | time.valid_datetime | time.base_datetime | time.step | vertical.level | vertical.level_type | ensemble.member | geography.grid_type | |
|---|---|---|---|---|---|---|---|---|
| 0 | pres | 2019-06-02 12:00:00 | 2019-06-02 12:00:00 | 0 days | 2000 | potential_vorticity | 0 | regular_ll |
Next, we interpolate the data to the target field.
[8]:
t_res_pv = vertical.interpolate_monotonic(
    t,
    target_coord=pres_pv,
    interpolation="linear",
)

t_res_pv.ls()
[8]:
| parameter.variable | time.valid_datetime | time.base_datetime | time.step | vertical.level | vertical.level_type | ensemble.member | geography.grid_type | |
|---|---|---|---|---|---|---|---|---|
| 0 | t | 2019-06-02 12:00:00 | 2019-06-02 12:00:00 | 0 days | 323.655547 | pressure | 0 | regular_ll |
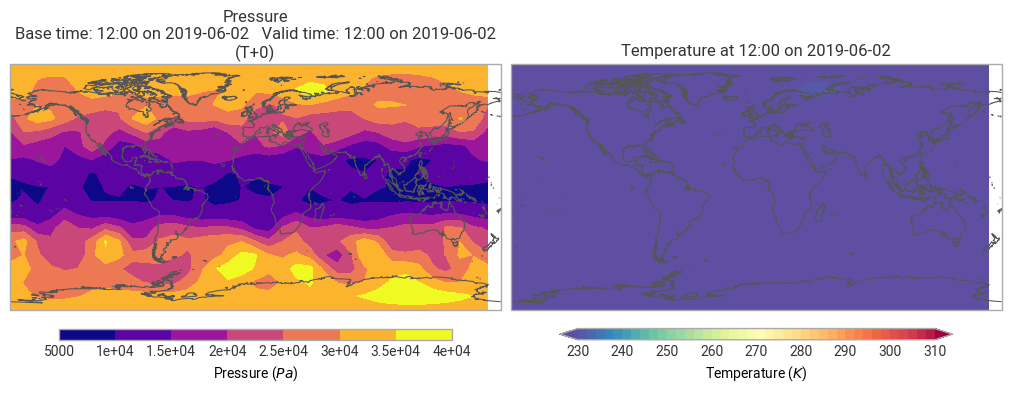
Finally, plot the pressure of the 2 PVU potential vorticity level and the temperature interpolated to it side by side.
[9]:
ekp.quickplot(ekd.FieldList.from_fields([pres_pv, t_res_pv]))
[9]:
<earthkit.plots.components.figures.Figure at 0x125b8f890>
Writing to GRIB
Currently, fieldlist based computations resulting in fieldlist keeping all the values in memory. We can save this data to GRIB with to_target.
[10]:
# write to GRIB file
t_res.to_target("file", "_pl_to_pl.grib")

# read back and check saved GRIB data
ekd.from_source("file", "_pl_to_pl.grib").to_fieldlist().ls()
[10]:
| parameter.variable | time.valid_datetime | time.base_datetime | time.step | vertical.level | vertical.level_type | ensemble.member | geography.grid_type | |
|---|---|---|---|---|---|---|---|---|
| 0 | t | 2019-06-02 12:00:00 | 2019-06-02 12:00:00 | 0 days | 870 | pressure | 0 | regular_ll |
| 1 | t | 2019-06-02 12:00:00 | 2019-06-02 12:00:00 | 0 days | 350 | pressure | 0 | regular_ll |
[ ]: